Code on GitHub.
So, you have one or many applications hosted in Azure and they are connected to Application Insights for logging, meaning every exception and logged error will be stored in Application Insights for 90 days (default retention). So far, so good.
Now, how do you treat your errors? Let's be honest, the amount of time developers spend looking at their logs varies a lot. I've been in projects where nobody ever looked at the logs, no one had the responsibility and no one really cared. Why is that? Do they lack the tools? Is the Azure portal too cumbersome to use? Are they lazy? Do they forget? Are the errors difficult to access?

Why on earth would you send your errors to Slack?
Well, first of all, the assumption here is that you are already using Slack in your organization. Otherwise, you would need some other communication tool, but the principles are the same.
Visibility, visibility, visibility
The errors should not be hidden away, only available for those few with the appropriate access roles and knowledge in navigating the Azure portal and the Application Insights log UI or being an expert in the Kusto query language.

Errors happening in the test environments are important. They should be dealt with in a serious manner. Proactivity can save you from a lot of production headache.
The application errors are not only for the developers. The whole team/organization should be able to see them. They might not understand them, but they get a picture of the state of the system.
So why Slack?
- Get the errors straight in your face!
- Get them when they happen.
- Everyone can see the errors.
- Test environment errors gets attention.
Warning! Noise incoming!
Sending all exceptions and errors to Slack unfiltered may cause a lot of noise. If the alerts become a wall of noise, then you have failed, and you need to find a way to remove the noise. The errors popping up in Slack should be relevant, they should require attention and handling.
But even with some noise I'd argue that visibility > noise.

If the idea of sending errors to Slack feels like madness because it would be too many errors, then I'd argue that you have a fundamental problem with your system. Too many errors just becomes noise, and you lose control. You won't discover the errors that need attention, and apathy will start kicking in. In this case you need to get rid of the errors that are just noise, and boil it down to the errors that needs handling. When you have a good baseline, you can reconsider using Slack as an alert channel.
How does it work?
Let's get into the details.
First you need to decide how you will receive the alerts in Slack. I suggest that you create dedicated channels for each environment, i.e. #errors and #errors-test for the production and test environments. (You might want something more descriptive, but you get the idea).
Following the steps below, we will create an example app and connect it to Application Insights. Then we will configure an Alert rule that calls a webhook when exceptions occur. This webhook is provided by an Azure function app we're creating, called AlertHandler. This app will parse the alert and build a payload which is sent to a Slack webhook.

All code can be found in GitHub.
Step 1: Create an application which logs to Application Insights
I've created a Minimal API (dotnet new webapi -minimal) that looks like this:
var builder = WebApplication.CreateBuilder(args);

// Requires nuget Microsoft.ApplicationInsights.AspNetCore
builder.Services.AddApplicationInsightsTelemetry();

var app = builder.Build();
app.UseHttpsRedirection();

app.MapGet("/", () =>
{
    throw new Exception(
        "This text should appear in Slack!");
});

app.Run();
We deploy the app to Azure, and add the Application Insights connection string in the app settings in Azure.
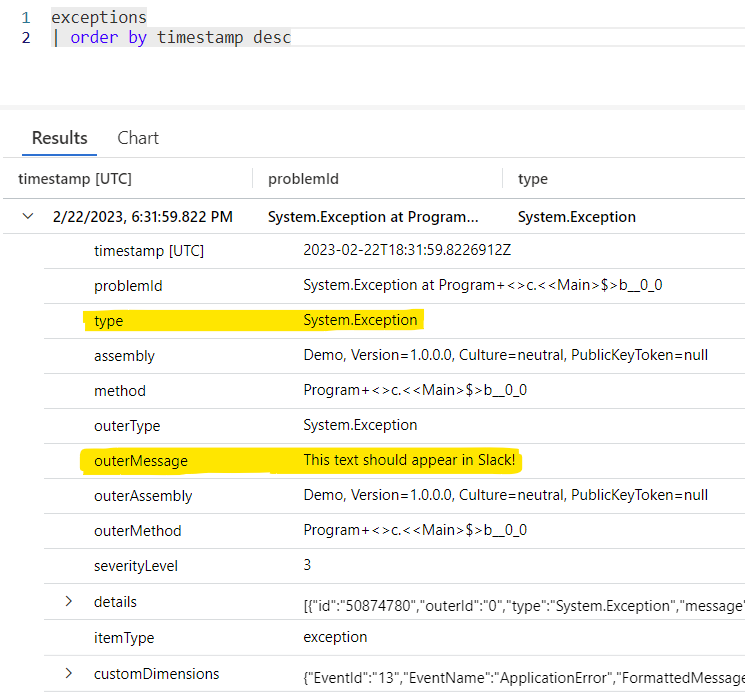
When navigating to the URL of the application, the exception will throw and be sent to Application Insights:
|
Notice the type and the outerMessage. We'll need those later.
Now we've got the baseline in place - an app logging errors to Application Insights.
Step 2: Create an alert
Application Insights is a part of the Azure Monitor suite, which also provides alerts. Alerts are pretty powerful because you can do a lot with them.
For demo purposes we will go through how to set it up using the Azure portal.
We create an alert of type custom log search which enables me to run a KQL query at certain time intervals, and perform an action if a specified condition is met. The KQL query counts the number of errors found in the time interval specified, grouped by cloud_RoleName, type and outerMessage.
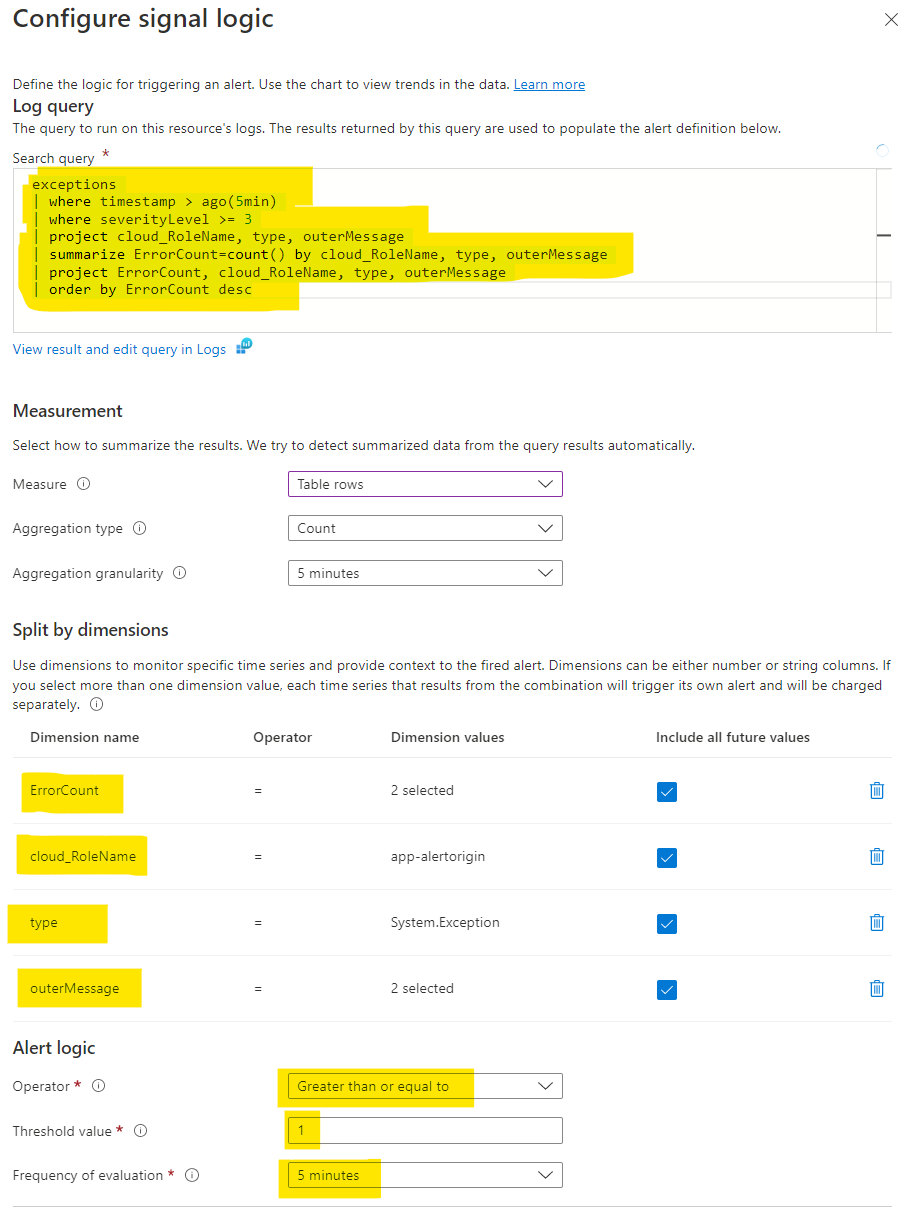
There are some important stuff here:
- The query filters exceptions which happened the last five minutes.
- The alert logic runs the query every fifth minute (which should include everything). If any exceptions (greater than or equal to 1) the alert should fire.
- Four dimensions are specified:
type,outerMessage,cloud_RoleNameandErrorCount. This is the information we want to use in our Slack messages.
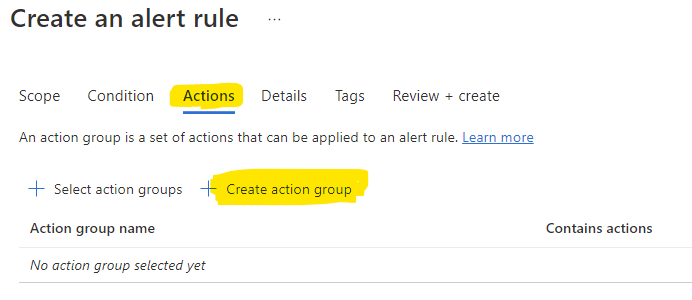
When creating the alert rule we need to assign it to an action group:
|
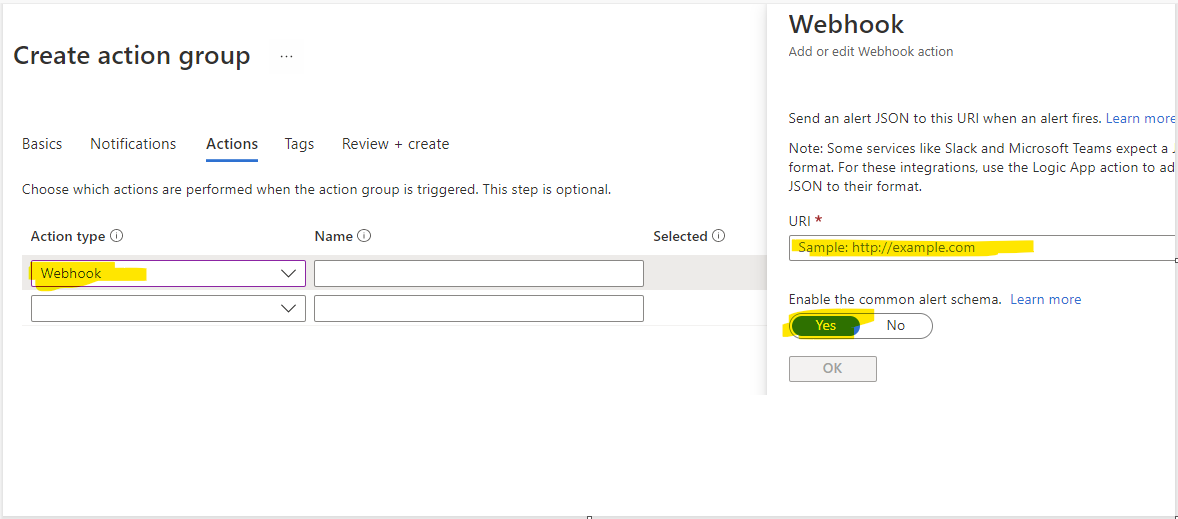
And since we don't have any we'll create a new one:
|
This is where you specify the URL of the webhook that should be called. It cannot call the Slack webhook directly because it does not follow the contract Slack uses. Therefore we need something in the middle, that can parse the common alert schema used by Application Insights and post to the correct format to Slack.
We will add the action to the alert when we have the URL for the webhook.
Step 3: Create the webhook that receives the alert
We need to create an Azure function with a HTTP trigger that will act as a webhook for the alerts. I'll call this function AlertHandler. The alerts follow the common alert schema and must be parsed by the AlertHandler. It will then subtract the most essential information:
- Cloud rolename
- Outer message (
This text should appear in Slack!) - Link to search results
We will build a payload based on this and send it to the Slack webhook.
The HTTP trigger will look like this:
[Function("HandleExceptions")]
public async Task<HttpResponseData> Run([HttpTrigger(AuthorizationLevel.Function, "post", Route = "exceptions")] HttpRequestData req)
{
    var alert = JsonSerializer
        .Deserialize<LogAlert>(await new StreamReader(req.Body)
        .ReadToEndAsync())!;

    _logger.LogInformation($"Exception alert: {JsonSerializer.Serialize(alert)}");

    await _slackApi.Send(BuildText(alert));

    return req.CreateResponse(HttpStatusCode.NoContent);
}

private static string BuildText(LogAlert alert)
{
    // Adding an emoji because I can, and to give some life to the alert
    return $":boom: New errors ({alert!.GetErrorCount()}): <{alert!.LinkToSearchResults()}|{alert!.ExceptionMessage()}>";
}
All of the code for the AlertHandler can be found in GitHub.
When deploying this code to a Function in Azure it will generate a URL with a code (apikey) which can be used as the alert action webhook.
Step 4: Create a webhook in Slack
We need to create a webhook in Slack. You can find your apps here: https://api.slack.com/apps
Create a new app:
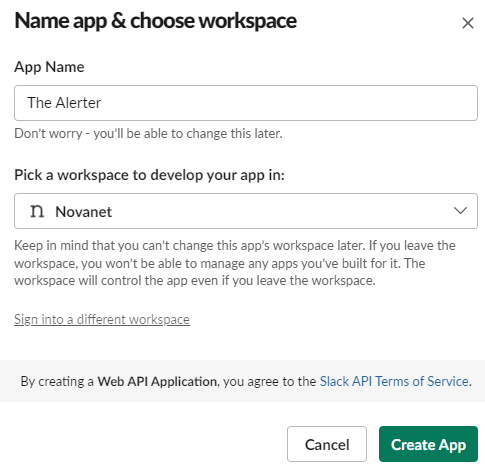
Activate incoming webhooks and create a new one. You will need to specify which Slack channel the messages should be posted to:
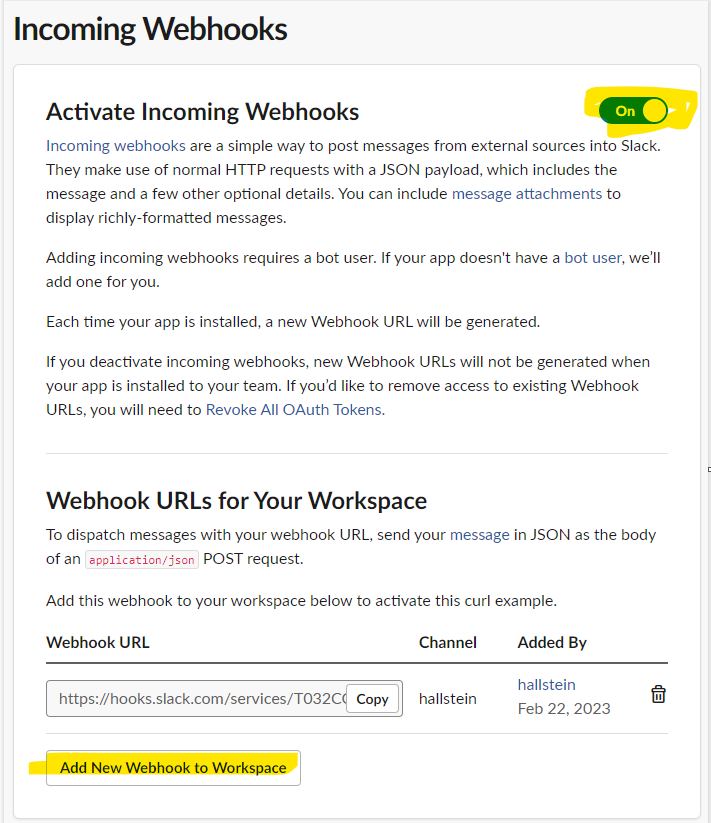
Copy the incoming webhook URL. We'll need it for step 5.
Step 5: Tie it all together
There's a couple of things remaining:
- The AlertHandler must set the app setting
SlackExceptionsWebHookto the incoming webhook URL provided by Slack. - The AlertHandler function has a URL which can be retrieved from the Azure portal. It should contain a code in the URL, which acts as an api key. The Alert we created in the Azure portal needs to have an action of type webhook which points to this URL.
Step 6: Testing testing testing
The app will produce an exception when navigating to it's root endpoint. During the next five minutes an alert should kick in, and you can find the fired alerts in the Azure portal:

Your Slack channel should receive the following message:

You get errors directly in Slack! Winning!

Grouping errors
There's a nice feature here that you must be aware of. The errors will be grouped by dimensions in the specified time interval, and you will only get an alert once for each group (that means distinct result for the dimensions).
So, if we generate 31 errors with the same dimensions (in my case: cloud_roleName, outerMessage and type), we will still only get one alert for these.
That is why we added ErrorCount to the query, to see how many of each error has occured.
Here's an example where my app generates two unique errors multiple times (31 and 8), and the output in Slack is:

I like this, because it prevents spamming to a certain degree. I think of it as a burst cache for the errors. But it does mean that you need to do some research to find the extent of the error. That's the reason I like to format the error message as a URL which points to a query for the specified time interval in Application Insights, so you will get to the details in one click.
The result
We end up with the following flow:
- The app logs to Application Insights.
- An alert rule triggers and call a web hook in the AlertHandler function.
- The AlertHandler process the alert (Common Alert Schema), performs relevant noise filtering and posts messages to Slack

Batching
There are ways to batch the errors. You can increase the timeframe to something more that five minutes, but that will give you a longer time from errors happen to you get a notification.
For instance, you could have an alert running once per day, giving you a summary of the top 10 errors for the previous day. That would give you a nice insight into where you should place your error resolving efforts.
Logging errors
This blog post has only shown how to handle exceptions. What about explicitly logged errors? It's almost the same thing. We could handle those errors as well by extending our implementation with the following:
- A new alert rule for handling traces with new dimensions (you need
messageinstead ofouterMessage) - The alert rule action group must use another webhook for the AlertHandler
- The AlertHandler needs a new HTTP trigger to handle the traces (the parsing is a bit different, i.e. you would use the message, not the outerMessage)
- The Slack webhook and app can be used as-is.
When creating the alert rule, the KQL query could look like this:
traces
| where severityLevel in (3,4)
| where timestamp > ago(5min)
An alternative way - pulling the data
Another way of doing this is using the Application Insights API, and pull the data instead. You can achieve the same thing by running API calls at given time intervals and query for a given timeframe. The API calls enables you to post KQL queries directly to Application Insights.
The implementation details for this is out of scope for this blog post.
Where do we go from here?
So where do you go from here? Why stop at errors?
- Availability tests? Send info about public endpoints not answering to Slack.
- Azure Service Bus? Send info about new items in Dead Letter Queue to Slack.
- Create a DevOps channel for production deploys.
- Create a trigger that notifies about expiring SSL certificates.
- Send important metrics.
- Maybe some info about stuff happening in the solution as well? New customer signed up!
Of course, as previously stated, with respect to the incoming noise ratio, the information must give value to the audience.
Either way, using Slack (or another similar tool) can give you a lot of easy accessible insights to what's happening in your solution.

References:


Images made with Midjourney and data flows using draw.io


