
As we all know, any cool web application have some sort of WebSocket communication, either it is based on signalR, socket.io, or some other extremely cool technology.
Developing these solutions make developers feel like wizards, as perfectly demonstrated in this clip from The Big Bang Theory. That is, when they work. When they don't, it sure is harder to debug than the good old request response.
F12-tools to the rescue
Or is it harder? It turns out Google Chrome F12-tools is actually quite good at handling web sockets, and it is now very easy to see what is going on! It is just a bit harder to find the information we are looking for.
Example of use
To quickly show how it works i created a chat room on http://jabbr.net, and joined with my Twitter account. My friend also joined:
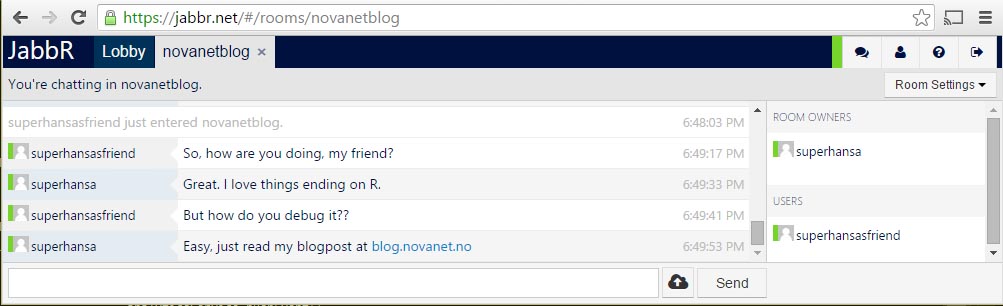
Since jabbr.net is based on signalR communication we should be able to track the messages in F12-tools.
Here is a step by step guide for debugging the communication:
-
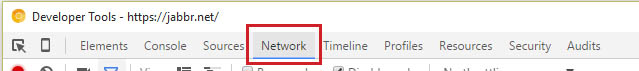
Start by opening F12-tools and selecting "Network".
-
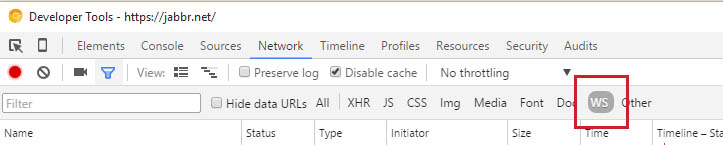
In the network log, select the "WS" filter to only show WebSocket connections.
-
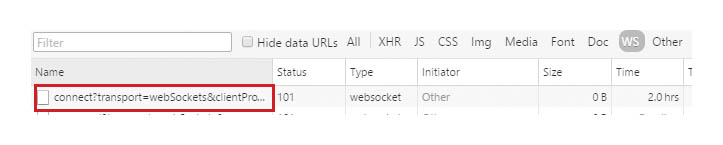
Open a chat room on http://jabbr.net, and verify that you get a record with a name starting with "connect?transport=webSockets..." in the list.
-
Click on the name of the record, and select the tab "Frames".
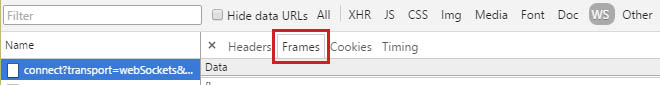
-
Type a message in the chat room, and find it among the frames:
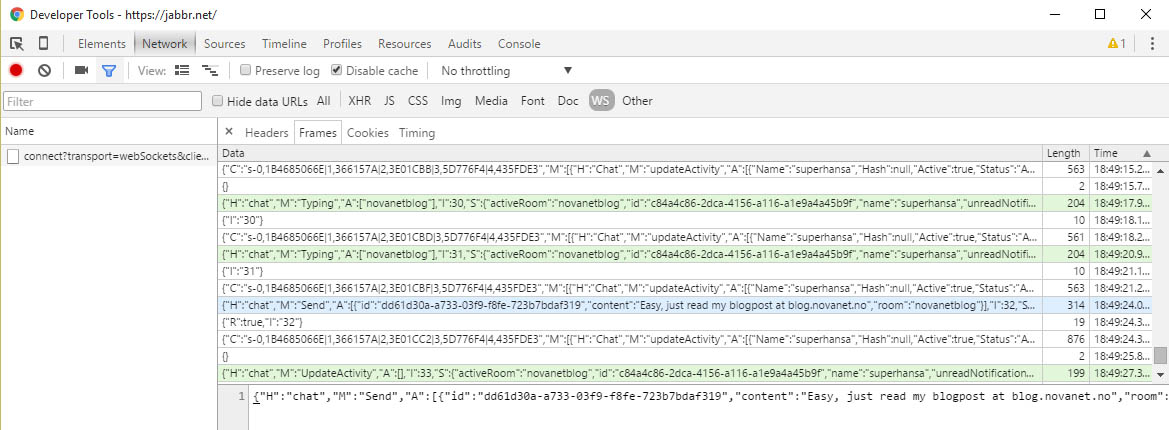
You will see that messages triggered by your client are green, while messages from the server are white.
You can select a message to inspect the payload. The payload is usually JSON-data in my projects, but as of now Chrome does not parse it for you. Be aware that according to the WebSocket protocol the payload can be split into several frames.
This makes it pretty simple to see actual messages, and find out if your client is handling them wrong, or if the server never sent them.
Now try the same on http://shootr.signalr.net/ and be amazed by the number of messages sent on the WebSocket :-)